Solution in the post is tested on Visual Studio 2008 & Visual Studio 2010
The best location to place java script in an ASP.NET application will be to put in a custom Java script file, conventionally “common.js” or “[appName].custom.js”.
However, it’s not always possible to do this as we sometimes need to access the client IDs of the server controls and our javascript code end up looking like this:
var submitButton = document.getElementById("<%= Button1.ClientID %>");
var name = $("#" + "<%= NameLabel.ClientID %>").text(); //using jQuery
We need to place such code in the .aspx or .ascx files within the script tags. There are a couple of ways in which we can debug either of them in Visual Studio.
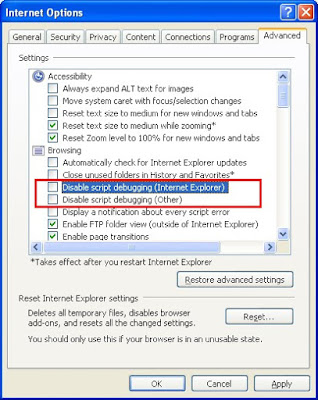
NOTE: For the solutions mentioned below to work, we need to uncheck the disable script debugging in the Internet Explorer settings. Also this solution works only with Internet Explorer. We always have the option to fire the bug and go crazy!
A very quick and handy way the works very well in the development phase is using the debugger; command.
The debugger; command is frowned upon by some as the whole idea of making a change in the code in order to debug sounds odd. The good thing about debugger is that we can place this in the “onload” and “oninit” handlers or $(document).ready() and expect the control to. This would work every where, whether within a script block on a page or in the custom .js file.
Refer to the example below:
<%@ Page language="C#" autoeventwireup="true" codebehind="Default.aspx.cs" inherits="DebuggingJS._Default" %>

<!DOCTYPE html PUBLIC "-//W3C//DTD XHTML 1.0 Transitional//EN" "http://www.w3.org/TR/xhtml1/DTD/xhtml1-transitional.dtd">
<html xmlns="http://www.w3.org/1999/xhtml">
<head runat="server">
    <title>Debugging Java Script</title>
    <script src="Scripts/jquery-1.3.2.min-vsdoc.js" type="text/javascript"></script>
    <script src="Scripts/jquery-1.3.2.min.js" type="text/javascript"></script>
</head>
<body onload="client_Load()">
    <form id="form1" runat="server">
    <script type="text/javascript">

        function client_Load() {

            debugger;

            var text = $("#" + "<%= Label1.ClientID %>").html();
            $("#" + "<%=Label1.ClientID %>").html(text + "<br />client_Load()called!");
        }

        $(document).ready(function() {

            debugger;

            var text = $("#" + "<%= Label1.ClientID %>").html();
            $("#" + "<%= Label1.ClientID %>").html(text + "<br />$(document).ready() called!");
        });

    </script>
    <div>
        <asp:label runat="server" id="Label1"></asp:label>
    </div>
    </form>
</body>
</html>
Word of caution - This command needs to be deleted before you check-in or publish, for obvious reasons.
On a side note, if you see what the script is doing, $(document).ready() is fired before body tag’s onload is being fired on my machine.
Another option the Visual studio provides us - The visual studio style debugging:
Run a web application in Debug Mode, check out the solution Explorer:
 The Windows Internet Explorer node gives the response that the application will send to the browser. This includes rendered HTML (localhost file in the image), java script files and other resource files.
So what do we have to do if the script is sitting in a separate .js file?
Well NOTHING!
Just put a brake point as we always do and run the application in debug mode.
The Windows Internet Explorer node gives the response that the application will send to the browser. This includes rendered HTML (localhost file in the image), java script files and other resource files.
So what do we have to do if the script is sitting in a separate .js file?
Well NOTHING!
Just put a brake point as we always do and run the application in debug mode.

And we can expect the obvious result.

However, it’s worth noticing that the java script that hits the breakpoint is in the Windows Internet Explorer node.
In case of java script in the .aspx/.ascx files:
Open the rendered page in Windows Internet explorer node, spot the code that needs to be debugged and put a break point on it.
 You’re all set!
 Hit refresh, if it’s a page load / document ready handler or take the user action needed, Visual studio will be sure to stop on the debug point.
Not just that, you can check value or variables just like you quick watch and add watch.
This comes like a blessing if you are working with a third party control and looking to find out an exhaustive list of client side APIs.
Just like I’m blessed with the Telerik’s RAD Grid’s client side methods and properties below:
 You get the exhaustive client side method and properties at one place.
How neat is that!
You get the exhaustive client side method and properties at one place.
How neat is that!
Perfect! It helped me a lot...
ReplyDeleteThank you, for your great explanation
ReplyDeletecool tip by the way you can also debug java script in firefox using firebug, here is another useful link related to 10 tips to debug java program in eclipse
ReplyDeleteDid you even read the article on this page... or are you just using this as a place to create links to your own page?
DeleteThe article on this page is about javascript debugging... and your link is about Java debugging.
Thanks a lot dude
ReplyDeleteThansk a lot
ReplyDeleteHi, I have followed your instruction, but it didn't work for me, when I ran the html file with javscript tag and debugger; command in there. It just open the webpage, not pop up the Visual Studio debuger. (I am running Windows 7 x64 bit - Vsual Studio 2010)
ReplyDeleteHi, it not work for me, it just open the webpage. I am running Windows 7 x64 bit , and Visual Studio 2010
ReplyDelete@Cam Thang Duong –
DeleteI hope you are using Visual studio with IE as your default browser.
I tried pure .htm / .html pages (which I had not tried earlier) and I was able to hit the debugger/breakpoint.
Alternatively you can use IE Developer tools to debug in browser.
To start debugging –
• Load the page in IE and press F12 to activate dev too.
• Select the “Script” tab and click on the “Start debugging” button.
Now you will hit the debugger; automatically.
You can also place break points, like in Visual studio.
This is the best article I have read in the Web Development context. Thanks very much for taking the time to share your ideas.
ReplyDeleteThank you Sofia, happy to help.
DeleteComments like yours keep me inspired.
This is such a great resource that you are providing and you give it away for free. I love seeing websites that understand the value of providing a quality resource for free. It is the old what goes around comes around routine. Search Bar Firefox 57 Quantum addon
ReplyDelete